Web app load speed matters. Users want to find answers to their questions fast. An extra-second delay can have a significant impact on the overall performance of your page, from customer satisfaction and conversion rates to the search engine ranking position.
According to Google, if your page takes more than 3 seconds to load, over half of mobile users will abandon it and go elsewhere.
The research also showed that 70% of the 90,000 websites it analyzed took almost 7 seconds for the above-the-fold content to display.
Luckily, there are a number of steps you can take to optimize your website for load speed and outpace your competition. In this article, we will guide you through some of them.
Additionally, we will:
- explain the basics of website performance,
- lay out the general benefits of speed optimization,
- present some recommended performance metrics.
Why should you optimize your web app for speed?
People’s attention is a limited resource, and in website design it’s all about instant gratification. Regardless of how well your content or services respond to your users’ needs, if your website’s performance is bogged down by poor optimization and unnecessary extras, people will turn away.
Page speed and user experience
Load speed is the first impression you make on your potential customers. A fast-loading page signals that your business is trustworthy and encourages visitors to spend more time browsing it. This applies in particular to new businesses that want to increase their brand recognition.
In one survey, 79% of respondents said they were less likely to purchase from a website if they were dissatisfied with its performance.
It’s also been reported that more than 75% of online consumers would rather head to a competitor’s website than put up with delays.
In case you’re still unconvinced, a study by the University of Nebraska-Lincoln found that the users’ tolerable time for information retrieval is approximately 2 seconds, reinforcing the case for rapid web load times
As one of our clients said, “We should improve performance out of respect for our users,” and this is a principle we’re fully behind.
How website performance affects conversion rates
Put simply, poor user experience translates into poor conversion rates. Even a millisecond-long delay can have a significant impact on your ability to increase conversion and retain repeat business. Here are some real-world examples—taken from WPO stats—of how web app optimization led to increased monetary benefits:
- Trainline reduced latency by 0.3 seconds across their funnel, and customers spent an extra £8 million (~$11.5 million) a year;
- Walmart saw up to a 2% increase in conversions for every 1 second of improvement in load time, while every 100-ms improvement also resulted in up to a 1% increase in revenue;
- AliExpress reduced load time by 36% and saw a 10.5% increase in orders and a 27% increase in conversion for new customers.
How website performance affects SERP ranking
In 2015, mobile searches outnumbered desktop searches for the first time. In response to this development, Google began ranking all search results in early 2018, including the desktop ones, taking into account the mobile experience of your web page.
This means that if you want to keep or improve your visibility, you have to take steps to reduce load time across all versions of the page. You can start by taking a look at this Google tool that helps you optimize your site for the mobile-first index.
However, bear in mind that load time is not the only factor behind Google’s search engine algorithms. If your page already ranks low because it doesn’t provide compelling content or you neglect the SEO front, slimming it down for the sake of reducing load time will not suddenly land you the top spot.
What exactly is web page performance?
To implement the right measures, the first thing you need to do is identify which aspects of your web performance need improving.
Most developers are already familiar with browser developer tools. Automated tools like Lighthouse audit the performance of any web page and generate reports that specify what drags down your page load speed.
But if you’re after a more in-depth analysis, check out WebPageTest. It allows you to run multiple concurrent tests and gives you a number of location, device, and connection speed options to choose from.
Below we’ve listed some of the indicators WebPageTest provides data on. Working towards improving at least some of them will help you speed up your page load time a great deal.
Time to first byte
When someone visits your website, their browser requests certain information, such as the page’s URL, from a server. Time to first byte (TTFB) is a metric that captures how long it takes your browser to receive the very first byte of the requested information.
While the average TTFB is 100–500 milliseconds, Google recommends reducing your server response time to a maximum of 200 ms.
Start render (also known as first paint)
Start render indicates how long it takes for the first elements of the website’s layout, like the background, to start appearing on a previously blank screen.
It gives the user clear visual feedback that the page is opening and they can expect the rest of the content to follow shortly. This happens after all render-blocking scripts and styles have been downloaded, parsed, and executed.
The recommended start render timeshouldn’t exceed 1–2 seconds.
First contentful paint
During this stage, users start seeing content (images or text) on the site, and their expectation that the page is about to load fully is reinforced.
If you experience any delays in this phase, it usually means that you should optimize your font delivery.
Speed index
Speed index describes the average amount of time it takes for the above-the-fold content of your page to appear on a user’s screen.
It’s not a specific point-in-time metric, but rather an aggregate of your page’s metrics that calculates how “complete” the page is throughout the various stages of loading.
Speed index depends on how your page is built. If you have a lot of heavy above-the-fold content, the score might be poor.
Time to interactive
This metric measures how long it takes for your website to become fully interactive.
Put simply, this is the time when the user can fiddle with buttons and inputs and expect them to work.
This state has several requirements. The most important one is that the event loop should now take less than 50 ms.
Fully loaded
Finally, there is the fully loaded state, when all the initial assets (including those triggered by your scripts and styles) have finished downloading.
How to optimize your website for speed?
Once you’ve identified your problem areas, it’s a good idea to prioritize them before you begin optimization. Remember that you don’t have to try and tackle all weaknesses straight away.
By implementing too many changes at once, you might lose track of what works and what’s unnecessary. Start off with the most pressing issues and work your way down the list we’ve compiled below, bearing in mind that it is by no means exhaustive.
DNS queries optimization
While there is very little we can do about the first DNS request, we can optimize requests that appear in our HTML files with one simple trick: DNS prefetch. This tells our browser we’ll be using those domains soon, even though it can’t see the resources yet.
DNS prefetch is mostly useful for vendor scripts and CDNs. Overall, this can reduce the load time by as much as 5%.
SSL negotiation
TLS 1.3 has been out since August 2018—just enable it.
This version has a lot to offer. Most notably, its simplified handshake will lower the negotiation timing by at least a third. Even though browser support is not universal yet, it will fall back to TLS 1.2 cleanly.
IPv6
Enabling IPv6 can bring a surprising amount of speed to your products. Research by Facebook showed that IPv6 alone had increased its load time by 10–15%.
HTTP2 Push
Add a few headers to your web root and enjoy parallelism even more than before, because your server knows better what needs to be used to render the page.
Well, it’s not exactly that easy.
Bear in mind that you might experience some issues, mainly related to caching those resources and prioritization. Use this trick with caution, as every page load would add additional overhead, even if the user has already fetched the resources once.
Adapting Progressive Web App caching will solve most of these overhead issues.
We recommend that you send at least the critical CSS (unless you decide to inline this in HTML, which isn’t a bad idea, either) and the fonts (especially if used in critical CSS). You can still preload all other resources from your HTML.
If you want to work around not having a PWA, there are some solutions around the conditional push with cookies.
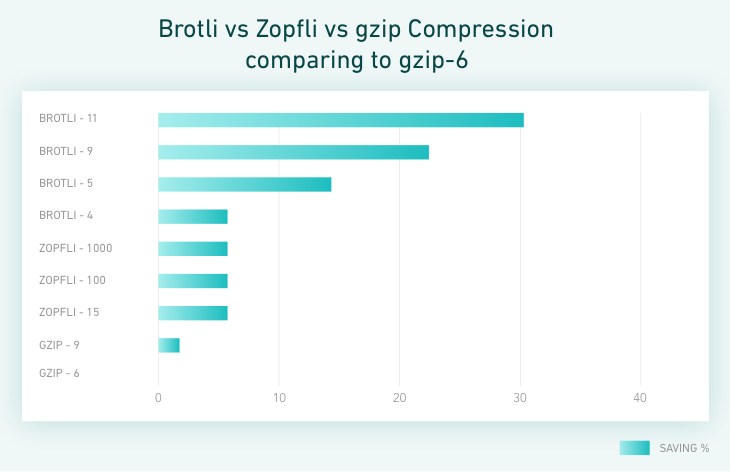
Brotli
This compression algorithm has been around since 2015, but its adoption rate has been surprisingly low.
It’s fast to decode and produces smaller files than gzip. But the encoding, depending on the compression level, can take longer than just sending the file uncompressed.
Pro tip: pre-compress the assets and configure the server to send those instead of using the raw version. If you can’t use Brotli for whatever reason, pre-compress gzip, too.
HTTP 3
Previously known as “HTTP over QUIC” (with QUIC being a new network transport protocol using UDP), HTTP3 has been officially accepted as the follow-up to HTTP2.
The project has not been finalized yet, but it promises to be an exciting development. Make sure you stay tuned, so that you can use it to your advantage when it’s out.
Critical CSS
This neat trick can significantly change how users see your page, but it can also be extremely hard to introduce unless you plan for it beforehand.
There are two ways to go about it:
- provide an “application shell”—a simple DOM that introduces the layout and basic styling, then replace it with actual content;
- plan your styling in such a way that the browser will render a satisfactory amount of content with a very limited amount of styles.
This will help create a more engaging loading process for the user.
For existing apps, you can use a library that will try to extract all the rules applied to the above-the-fold content of the page. Go through the results afterwards to see which ones require further manual enhancement.
Font delivery optimization
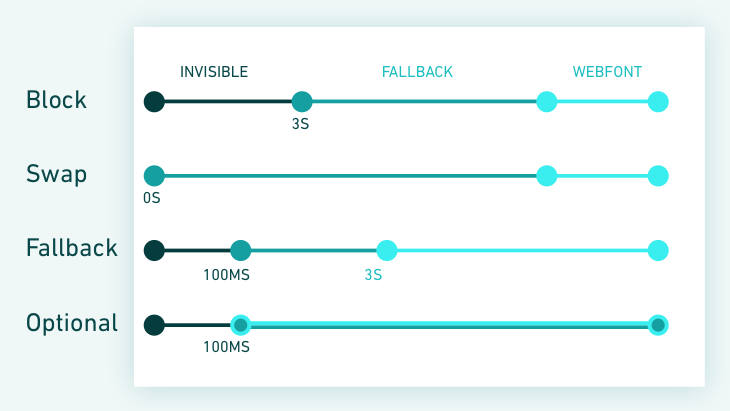
CSS won’t let the browser display your text unless the requested font is ready. Even though you could use HTTP push here, it’s often not enough.
The font-display property can fix this by displaying the text using the system font first, then swapping whenever possible. But beware: the replacement font might have a different size and make the layout flicker.
Parsing time
It pays to be mindful of this metric and try to strip out as much library code as possible. For instance, it can take several seconds for low-end devices to parse a megabyte of JavaScript, without executing even a single line of code.
Some browsers are old and support only JavaScript ES5. Don’t let them slow you down.
Using the script type module, we can serve scripts only to the browsers that support ES6 modules. For all the other browsers, we can use the nomodule attribute.
<script type="module" src="/main.js">
</script>
<script type="text/javascript" src="/main.es5.js" nomodule>
</script>
Use this to your advantage and create two different build targets: one for ES5 with polyfils, and one for ES6. This should significantly reduce your bundle weight for newer browsers.
The cherry on top is adding defer or async attributes to your scripts, so they can load without blocking the main thread.
How to optimize images in web apps
Pictures on a website make up for 60% of load size, on average. You can reduce it by following a few tricks.
1. Stop using img tags
Using picture tags is the smarter thing to do. They tell the browser what kind of images they have and let it pick the most optimal one to download, depending on the viewport size and supported formats.
Applying the tags everywhere can be challenging, but it should significantly reduce the size used across different devices or browsers.
<!--Change the browser window width to see the image change.-->

<picture>
   <source srcset="/media/examples/surfer-240-200.jpg"
      media="(min-width: 800px)">
   <img src="/media/examples/painted-hand-298-332.jpg" />
</picture>
2. WebP is cool
Although currently only 70% of users support WebP, you can work around it using the advice about picture tags above. WebP should bring significant improvements to the size of your images and, depending on the settings, you’ll probably have better quality than JPEGs, too.
If this sounds like your sort of thing, check out squoosh. It’s a Google app that can optimize your images and compare several algorithms and their results.
3. Lazyload
This should be quite obvious, but you don’t need to download the images the users can’t see. Chrome will soon try to default to lazy-loading images, but while you’re at it, just add the smallest library you can find to do the job for you.
The next step: Progressive Web Apps (PWAs)
Once you apply some (or all) of the tips above, the load speed of your web app should increase.
Luckily, you won’t have to go through the same process for repeat visitors to experience the benefits again. If you use caching, you’ll be able to reduce the amount of elements your users have to download when they revisit your site, and speed up the load time further.
Progressive Web Apps (PWAs) are the answer when you want to cache. They can be deceptively simple, so don’t get caught out—caching is inherently hard. But, when used appropriately, PWAs can provide huge benefits.
Workbox is a library that implements most of the reasonable cache strategies and lets you implement them in a manageable way.


